

A dashboard that combines real-time operations, revenue, client, and staff metrics delivers the fastest improvement in utilization and profitability for pet businesses, which is why understanding why pet data matters is crucial for owners and pros alike. Prioritize four categories: live occupancy and appointment status, daily revenue by service, client retention, lifetime value, and staff utilization. Skip vendors that can’t show you a live sample. Your next move: schedule a demo or run a 14-day pilot with a dashboard that pulls from your booking system, POS, and client records at once.
TL;DR:
- Dashboards should primarily focus on occupancy, revenue, retention, and staff utilization, with real-time data from booking and POS systems.
- Use pre-built report templates like occupancy heatmaps, service-mix profit reports, and client retention summaries for quick insights.
- Ensure dashboard integration with core systems is seamless, real-time, role-specific, and supports multiple locations to prevent outdated or irrelevant data.
- Regularly review key metrics, assign a dedicated owner, and train staff to embed dashboard use into daily routines for effective management.
- Protect sensitive client data through role-based access, encryption, and secure backups, and avoid information overload by limiting metrics tracked initially.
Table of Contents
- What Do Pet Business Analytics Dashboards Actually Track?
- Which Pre-Built Report Templates Should You Use?
- How Do You Choose and Set Up a Dashboard?
- How Should You Use a Dashboard Day to Day?
- Customizing Dashboards for Your Type of Pet Business
- Data Visualization Best Practices for Pet Business Dashboards
- Setting Goals and KPIs for Your Pet Business
- How Do You Interpret Metrics and Make Better Decisions?
- Keeping Client and Business Data Secure
- Common Pitfalls When Rolling Out a Dashboard
- The Dog Gurus Perspective: Coaching Plus Dashboards
- How The Dog Gurus Helps You Turn Data Into Daily Action
- Sources
What Do Pet Business Analytics Dashboards Actually Track?
Pet business analytics dashboards pull together the numbers that used to live in three or four separate systems. A well-built dashboard gives you one screen that answers “how are we doing right now” instead of forcing you to open your booking software, then your point-of-sale system, then a spreadsheet you update every Friday.
The strongest dashboards for pet care retail and services organize around four buckets:
- Operational metrics — live occupancy, today’s appointment count, no-show rate, and check-in/check-out flow. A daycare running at 62% capacity on a Tuesday afternoon needs to know that before 2 p.m., not after closing.
- Financial metrics — daily revenue, revenue by service line, average ticket size, and accounts receivable. Groomers often discover their add-on services (nail trims, teeth brushing) generate a disproportionate share of margin once they see revenue split by service.
- Client metrics — new clients, retention rate, lifetime value (LTV), and booking source. NielsenIQ’s pet industry outlook points out that pet owners are becoming more value-conscious, which makes retention and service-mix tracking a first-order priority, not a nice-to-have.
- Staff metrics — utilization rate, revenue per staff member, and commission accuracy, which directly inform scheduling decisions.
Pro Tip: If you only track one client metric this quarter, track booking source. It tells you which marketing dollar actually turns into a paying client, not just a click.
Which Pre-Built Report Templates Should You Use?
Most pet business software ships with templates you can use immediately instead of building from scratch. Real-world examples from vendor libraries show a consistent pattern across 40+ report types built specifically for pet operators:
- Morning check-in snapshot — today’s appointments, current occupancy, and staff on shift. Owners and shift managers use this first thing to catch scheduling gaps before they become customer complaints.
- Occupancy heatmap — hour-by-hour capacity across the day or week, useful for managers deciding whether to open a waitlist or add a shift.
- Service-mix profit report — revenue broken down by grooming, boarding, daycare, and training, typically reviewed by the owner or bookkeeper monthly.
- End-of-day revenue and A/R summary — closes out the books daily, usually the accountant’s or office manager’s job.
- Client health report — retention trends, lapsed clients, and LTV by segment, reviewed by whoever owns marketing decisions.
Gingr’s analytics platform documents built-in libraries running to roughly 80 ready-made reports, covering appointments, occupancy, booking source, and staff performance without requiring any custom development. Scheduled or automated delivery of these reports, sent to the right inbox on the right day, cuts the hours a manager would otherwise spend pulling numbers manually.
How Do You Choose and Set Up a Dashboard?
Picking the right dashboard starts with what it connects to, not how pretty the charts look. Run through this checklist before you sign anything:
- Does it integrate natively with your booking system, POS, and payroll, or will you be stuck exporting CSVs by hand every week?
- How current is the data? Real-time or near-real-time (updated within minutes) matters far more for occupancy than for monthly LTV trends.
- Does it support multiple locations if you run more than one facility?
- Is pricing transparent, with no hidden per-report or per-user fees?
- Can you assign different views by role, so front-desk staff see occupancy while the owner sees revenue and A/R?
Ask vendors directly: “Can I see a live demo with real data, not a mockup?” and “What happens to my historical data if I switch platforms?” A vendor that dodges either question is a red flag.
Once you’ve picked a platform, follow this setup sequence:
- Map your data sources — list every system that touches money, bookings, or staff hours.
- Pick 2 to 4 KPIs to pilot — occupancy, daily revenue, retention rate, and booking source are a solid starting set.
- Assign one owner — a single manager checks the dashboard daily so it becomes a habit, not an afterthought.
- Run a 14-day trial before rolling it out facility-wide, which mirrors the short pilot approach many operators use to catch integration problems early.
How Should You Use a Dashboard Day to Day?
A dashboard that nobody checks is just an expensive screensaver. Build it into routines instead of treating it as a once-a-month curiosity.
Daily, start with a morning snapshot: current occupancy, today’s appointments, and any overnight no-shows that need a follow-up call. Check A/R for anything overdue before it becomes a collections problem.
Weekly, review your service mix to see which offerings are actually driving margin, reallocate marketing spend toward the booking sources producing the best return, and adjust staff schedules based on last week’s utilization numbers.
Monthly, look at LTV and retention trends together, check whether your pricing still matches demand, and review inventory reorder points if you sell retail.
- Pull the morning snapshot before your first client walks in.
- Flag no-shows for same-day follow-up calls, not next week.
- Reallocate 10% of next month’s ad spend toward your highest-LTV booking source.
Pro Tip: Pick one number to post on the break room wall each week. Staff who see occupancy or retention trending up start acting like it’s their number too, not just the owner’s.
Customizing Dashboards for Your Type of Pet Business
A dog daycare and a mobile grooming van have almost nothing in common operationally, so the same dashboard layout rarely fits both. Customization starts with matching metrics to your actual business model instead of adopting whatever a vendor sets as the default view.
Daycares and boarding facilities care most about occupancy, run capacity by time of day, and overnight staffing ratios. Groomers and mobile services lean harder on average ticket size, add-on attach rate, and drive-time efficiency between appointments. Trainers track class fill rates and package renewal rates instead of daily occupancy. Retail-focused operations need inventory turnover and reorder alerts layered onto the same screen as service revenue.
Role matters as much as business type. An owner wants a wide view across revenue, retention, and staff cost. A front-desk manager needs today’s appointment list and occupancy, nothing more. A groomer working commission wants their own utilization and ticket average front and center, not buried in a company-wide report.
Most platforms let you build separate saved views for each role, which keeps the dashboard useful instead of overwhelming. If your provider only offers one fixed layout for everyone, that’s worth flagging during evaluation. The best setups let an owner start broad, then drill into a single location, service line, or staff member without switching tools entirely.
Data Visualization Best Practices for Pet Business Dashboards
Good data buried in a bad chart is still bad data. The most useful pet business dashboards follow a few visualization rules that keep numbers readable under pressure, which matters when you’re checking occupancy between client drop-offs.
Use line charts for anything tracked over time, like daily revenue or occupancy trends across a month, since trend direction matters more than any single day’s number. Use bar charts to compare categories side by side, such as revenue by service line or utilization by staff member. Avoid pie charts for anything with more than four or five slices; they get unreadable fast and hide the number that actually matters.
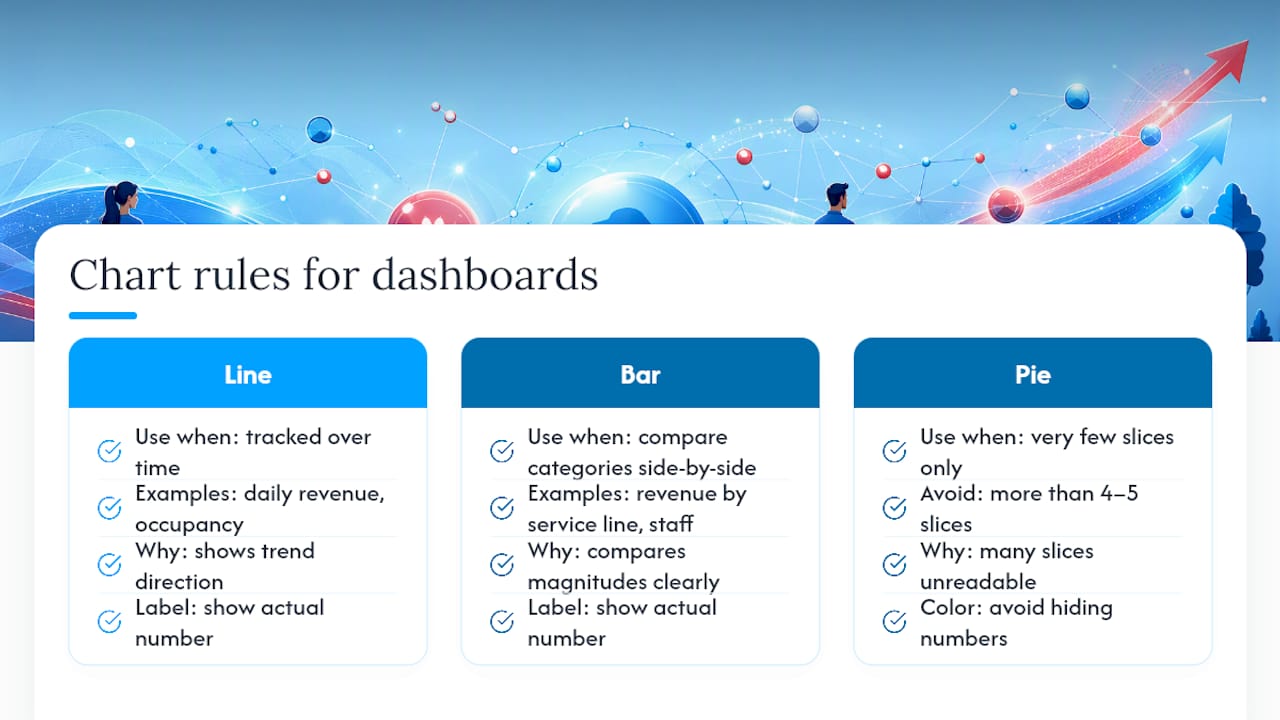
Color coding should mean something consistent across every screen. If red means “below target” on your occupancy chart, it should mean the same thing on your revenue chart, not a different threshold buried in a different color scheme.
Keep the most time-sensitive numbers, like today’s occupancy and appointment count, at the top of the screen where you see them without scrolling. Slower-moving metrics like monthly LTV trends can sit lower down. Label every chart with the actual number, not just a visual bar, since a manager glancing at a screen for three seconds needs the figure, not an estimate.
Setting Goals and KPIs for Your Pet Business
Vague goals produce vague dashboards.
Start with benchmarks specific to your segment rather than generic business targets pulled from an unrelated industry. Daycare and boarding operators typically anchor goals around occupancy rate and revenue per available spot. Groomers anchor around average ticket and appointments per stylist per day. Every business, regardless of segment, should set a retention target, since NielsenIQ’s research shows retention and service mix are becoming more important as pet owners get more selective about spending.
Set goals in tiers: a daily operational target (occupancy, no-show rate), a monthly financial target (revenue by service, average ticket), and a quarterly client target (retention rate, new client count). Reviewing all three tiers on the same cadence your dashboard reports them keeps goals attached to real numbers instead of becoming an annual planning exercise nobody revisits.
Tie at least one KPI to a specific action, not just a number to watch. If retention drops below your target, that should trigger a specific campaign or outreach call, not just a note in a meeting.
How Do You Interpret Metrics and Make Better Decisions?
A number by itself doesn’t tell you what to do. Context does.
Compare every metric against three references: your own historical trend, your stated goal, and, where available, an industry benchmark. A 5% drop in retention over one month might be seasonal noise; the same drop sustained over a quarter is a signal something changed, maybe a staff turnover issue or a service quality slip.
Watch for metrics that move together. If daily revenue is flat but average ticket size is climbing, you’re likely serving fewer clients at a higher price, which might be intentional or might mean you’re losing volume. If occupancy is up but revenue per spot is down, you may be underpricing.
Don’t act on a single day’s number. Use rolling averages, typically 7 or 30 days, before adjusting staffing, pricing, or marketing spend based on what the dashboard shows. The pet industry’s continued growth to a projected $165 billion in 2026 means demand is still there for most segments, so a soft number is more often an operational issue than a market one.
Keeping Client and Business Data Secure
Pet business dashboards hold sensitive information: client names, addresses, payment history, and sometimes pet medical records. Treat that data with the same care a veterinary clinic applies to patient files.
Limit access by role. Front-desk staff need appointment data, not full financial reports or payroll figures. Most dashboard platforms support role-based permissions, so use them instead of giving every employee the owner’s login.

Ask any vendor directly how they encrypt data in transit and at rest, and where their servers are physically located. Confirm whether they carry cyber liability coverage and how quickly they notify you in the event of a breach. If a vendor can’t answer these questions clearly, that’s a reason to keep looking.
Set a password policy that requires unique logins per staff member, not one shared password taped to the front desk monitor. Review who has access every few months, and revoke it immediately when someone leaves. Back up your data independently of your dashboard provider when possible, since relying on a single vendor for your only copy of client history is a risk not worth taking.
Common Pitfalls When Rolling Out a Dashboard
Most dashboard rollouts fail for the same handful of reasons, and almost none of them are about the software itself.
The biggest one: tracking too many metrics at once. A new dashboard with 40 visible charts overwhelms staff and nobody checks any of them consistently. Start with the 2 to 4 KPIs from your pilot and expand only once those become habit.
The second: nobody owns it. If the dashboard isn’t assigned to a specific manager who checks it daily, it quietly becomes background noise within a few weeks.
The third: bad data going in. If your booking system and POS use different naming conventions for the same service, your service-mix report will show numbers that don’t match reality, and staff will stop trusting the whole system.
The fourth: skipping staff training. A dashboard that only the owner understands doesn’t change daily behavior on the floor. Front-desk and grooming staff need at least a basic walkthrough of what their view shows and why it matters.
The fifth: treating the launch as finished. Dashboards need periodic review, since a KPI that mattered during your first year of operation may not be the right one three years later as your service mix shifts.
The Dog Gurus Perspective: Coaching Plus Dashboards
Dashboards show you the number. Coaching helps you decide what to do about it. We’ve seen daycare operators spot a slow Tuesday-Thursday occupancy pattern on their dashboard, then use a targeted midweek promotion to close the gap within a month. We’ve watched groomers cut no-show rates by pairing dashboard alerts with a same-day confirmation text script built into their staff training.
The pattern holds across every pet business we work with: the operators who improve fastest tie dashboard KPIs directly to manager accountability, not just to a monthly owner review. A 30-day pilot works best when it pairs two or three KPIs with a specific coaching conversation each week, asking not just “what happened” but “what will we do differently.”
— Oliver
How The Dog Gurus Helps You Turn Data Into Daily Action
A platform that pairs dashboard-ready templates with coaching can help users understand what to actually do with the numbers, so they are not stuck staring at a chart wondering where to start. Such platforms often combine expert-led training, hands-on coaching, and AI-powered business tools built specifically for dog daycare, boarding, grooming, training, and pet sitting operators, so the KPIs tracked connect directly to playbooks a team can run.
A demo walks you through a sample dashboard view alongside an onboarding checklist built for your specific service mix, whether that’s boarding occupancy or grooming ticket averages. You’ll also see how staff scheduling tied to utilization data fits into daily management, and how recurring revenue tracking connects to the client retention numbers your dashboard already shows you. Book a demo and see what a 30-day pilot looks like for your business.
Sources
Your dashboard is only as good as what feeds it, and most pet businesses run on five or six disconnected systems that need to talk to each other.
The core sources worth connecting: your booking or scheduling system (appointments, occupancy, cancellations), your point-of-sale (retail and service revenue), accounting software (A/R, expenses, reconciliation), payroll or time-clock tools (staff hours and utilization), your CRM (client history and communication), and review platforms (reputation signals that often correlate with retention).
Integration happens through one of four methods: native connectors built by the software vendor, open APIs your IT person or a freelancer can wire up, manual CSV imports for smaller operations, or middleware tools that sit between systems you can’t otherwise connect.
Data quality problems show up fast if you skip the basics. Standardize how you name services across systems, since “Full Groom” in your POS and “Grooming Full Service” in your booking app will not merge cleanly. Reconcile POS revenue against your appointment system weekly, a step vendor guidance consistently recommends to avoid miscounting revenue by service. Double-check time zones and sync latency too, especially if you run multiple locations across different time zones.
- U.S. Pet Industry Reaches $158 Billion in 2025, Poised for Continued Growth in 2026
- NielsenIQ — Pet industry outlook guide to 2026