

Running a dog daycare without tracking the right numbers is like driving without a dashboard. You might be moving, but you won’t know when something’s about to break. The core dog daycare benchmarks every U.S. operator should monitor are:
- Capacity utilization rate: a healthy range is generally recommended; significantly low utilization signals a pricing or marketing gap
- Daycare recurring-package penetration: target 40%+ of active clients on a package; Pulse RevOps flags this as the single highest-leverage revenue metric
- Average Daily Rate (ADR): rates vary across U.S. markets and typically range from moderate to higher figures depending on market premium
- Revenue per available spot (RevPAS): multiply ADR by utilization to get your true yield per slot
- Labor as % of revenue: labor costs commonly constitute a significant portion of revenue; elevated percentages may reduce margins
- Gross margin: 50%–65% for daycare-only; boarding and grooming add-ons push this higher
- Net margin: 10%–20% for a single-location facility in most U.S. markets
- No-show/cancellation rate: keep below 10%; above 15% erodes yield and complicates staffing
Start here this week: Pull your capacity utilization for the last 30 days.
Key Takeaways
| Point | Details |
|---|---|
| Capacity utilization target | Aim for 70%–85% annually; below 60% signals a pricing or marketing gap to address immediately. |
| Package penetration priority | Target 40%+ of active clients on recurring packages to stabilize cash flow and reduce no-shows. |
| Labor cost discipline | Keep labor at 35%–50% of revenue; above 55% compresses net margin and limits growth capacity. |
| Financial benchmarks | Single-location net margins of 10%–20% are typical; break-even falls at roughly 12–20 dogs per weekday. |
| Thedoggurus as your next step | The platform’s staff training modules, financial templates, and coaching help operators measure and act on every benchmark in this guide. |
Table of Contents
- Safety and daily operations benchmarks every facility should meet
- Financial benchmarks and valuation multiples that matter for your business
- Operational KPIs to track and how to calculate them
- Staffing, training, and culture benchmarks that protect your business
- How to collect, normalize, and act on your benchmarks
- What the numbers don’t tell you: a perspective on benchmarks in practice
- Thedoggurus gives you the tools to close the gap between your numbers and your goals
- Sources
Safety and daily operations benchmarks every facility should meet
Safe operations aren’t just an ethical obligation. They’re a financial one. One serious incident can cost more in liability, reputation, and lost clients than a full quarter of revenue. Here’s what “good” looks like across the five pillars of daily operations.
Intake and health screening
Every dog entering your facility should clear a documented intake checklist before their first day. Minimum requirements:
- Vaccinations: Rabies, DHPP (distemper/parvo), and Bordetella at minimum. Many facilities also require canine influenza (H3N2/H3N8) and leptospirosis, especially in high-density urban markets.
- Parasite prevention: Flea/tick prevention current within 30 days; fecal exam recommended annually.
- Temperament evaluation: A structured, documented assessment before the first group session. This is non-negotiable. Skipping it is the most common intake mistake operators make.
- Isolation protocol: Any dog showing signs of illness (coughing, vomiting, lethargy, discharge) should be separated immediately, with a written log entry noting time, symptoms, and staff action taken.
The AVMA companion animal care guidelines provide the authoritative framework for vaccination, sanitation, and safe housing practices that should underpin your intake policy.
Staff-to-dog supervision ratios
Ratios shift based on group energy and size. Use these as your operating targets:
- Calm, well-matched groups: 1 staff per 10–15 dogs is a widely cited baseline for active daycare groups
- High-energy or mixed-size groups: drop to 1:8 or lower
- Puppies (under 5 months) or reactive dogs: 1:5 or 1:6 maximum
- Boarding overnight: at minimum one staff member on-site or on-call with a documented check schedule
Ratios should be reviewed whenever group composition changes, not just at the start of a shift.
Facility design targets
- Minimum 75–100 sq ft of indoor play space per dog in active play areas
- Sight-lines across the full playroom with no blind corners; mirrors or camera systems where layout limits direct visibility
- Flooring: sealed concrete, rubber-coated, or purpose-built pet flooring that drains and disinfects efficiently
- Ventilation: 10–15 air changes per hour in play areas to control odor, humidity, and airborne pathogens
- Outdoor areas fully fenced with double-gate entry to prevent escapes
Sanitation and cleaning cadence
Daily minimums:
- Spot-clean play areas every 30–60 minutes during operating hours
- Full disinfection of all play surfaces, food/water bowls, and sleeping areas at end of each day
- Isolation room cleaned and disinfected after every use, with a written log
- Laundry (bedding, towels) washed in hot water daily
Weekly deep-clean: drains, walls, kennels, and outdoor surfaces. Log the date, staff member, and products used. If a suspected illness occurs, escalate to a full facility disinfection using a veterinary-grade product and notify affected clients within 24 hours.
Emergency preparedness
Every facility needs a written emergency plan covering fire evacuation, medical emergencies, severe weather, and escape. Review it with staff at least twice a year.
Pro Tip: Before peak holiday boarding periods (Thanksgiving, Christmas/New Year), run a full facility audit: check your isolation room capacity, confirm all staff are current on first aid, and review your no-show policy. Holiday periods are when incidents spike and staffing gaps hurt most.
Financial benchmarks and valuation multiples that matter for your business
Understanding your numbers at this level separates operators who grow from those who plateau. Here are the ranges that matter, grounded in U.S. market data.
Revenue ranges by format
Single-location U.S. dog daycares generally generate annual revenue within a broad moderate range. Adding boarding and grooming services can increase revenue materially, especially with effective capacity management. Premium urban facilities may generate revenues exceeding typical ranges.
Break-even typically falls at 12–20 dogs per weekday, depending on your cost structure and day rate.
Margin benchmarks
| Metric | Typical U.S. Range | How to Measure | Target / Stretch Goal |
|---|---|---|---|
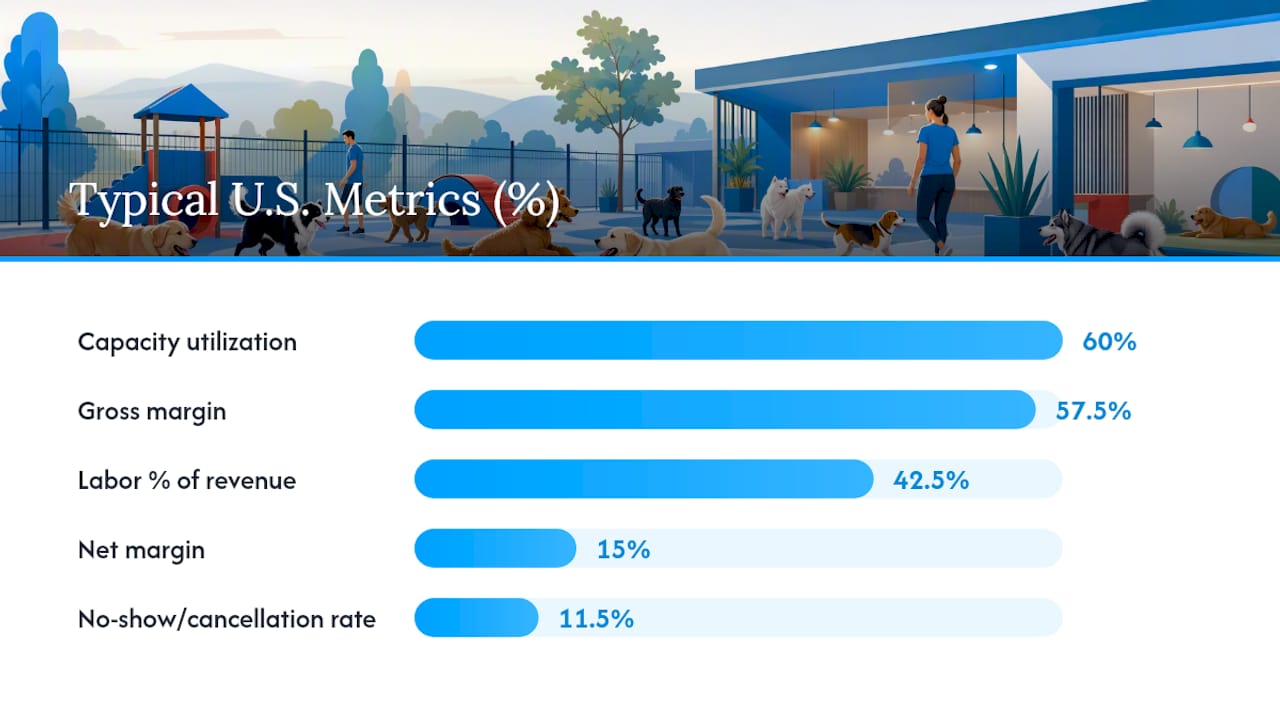
| Gross margin | 50%–65% | (Revenue minus direct costs) ÷ Revenue | 65%+ with add-on services |
| Net margin | 10%–20% | Net income ÷ Revenue | 20%+ with strong package mix |
| Labor % of revenue | 35%–50% | Total payroll ÷ Revenue | Below 45% with efficient scheduling |
| ADR (per dog/day) | $25–$45 | Total daycare revenue ÷ total dog-days | $40+ in mid-to-large markets |
| Capacity utilization | 60% | Dogs served ÷ licensed capacity | 80%+ in peak months |
| No-show/cancellation rate | 8%–15% | Cancellations ÷ total bookings | Below 10% |
Labor as a percentage of revenue
Labor is your largest controllable cost. Scheduling staff to match your actual dog count, not your maximum capacity, is the fastest lever most operators have available.
SDE, valuation multiples, and what your business is worth
Seller’s Discretionary Earnings (SDE) is the metric buyers use to value a dog daycare or boarding business. SDE equals net income plus owner compensation, depreciation, amortization, and any one-time or non-recurring expenses added back. It’s a cleaner picture of what the business actually generates for its owner than EBITDA, which doesn’t add back owner salary.
BizBuySell’s valuation benchmarks for dog daycare and boarding show transaction multiples and market trends that operators can use to estimate sale value.
Worked example: A facility with $200,000 in annual revenue, $80,000 in owner salary, $15,000 in depreciation, and $10,000 in one-time expenses, with a net income of $25,000, produces an SDE of $130,000. Facilities with strong recurring-package penetration, documented systems, and low owner-dependency tend to command the higher end of the range.
Operational KPIs to track and how to calculate them
Tracking the right dog daycare performance metrics on the right cadence is what separates reactive operators from proactive ones. Here are the four KPIs that drive the most decisions.
Capacity utilization rate
For daycare: Dogs served on a given day ÷ licensed daycare capacity × 100.
For boarding: Kennel nights sold ÷ total available kennel nights × 100.
Track this daily and review weekly trends.
Revenue per available spot (RevPAS) and ADR
ADR formula: Total daycare revenue ÷ total dog-days served. If you earned $6,400 in a week from 160 dog-days, your ADR is $40.
RevPAS formula: ADR × utilization rate.
RevPAS is more useful than ADR alone because it accounts for empty spots.
Recurring-package penetration directly lifts RevPAS by reducing no-shows and smoothing weekly demand.
Average length of stay and no-show rates
Average length of stay (ALOS) for boarding: Total boarding nights ÷ total boarding reservations. A higher ALOS means better revenue per reservation and lower check-in/check-out labor per dollar earned.
No-show/cancellation rate: Cancellations and no-shows ÷ total bookings. A deposit or prepayment policy is the most direct fix.
Recommended reporting cadence
- Daily: utilization rate, no-show count, dog count by service type
- Weekly: ADR, RevPAS, package penetration rate, cancellation rate
- Monthly: gross and net margin, labor %, revenue per service line, client retention rate
Staffing, training, and culture benchmarks that protect your business
Your staff-to-dog ratios and training standards aren’t just safety measures. They’re the foundation of your reputation and your ability to scale.
Ratio benchmarks and mixed-energy groups
The 1:10–1:15 ratio for active daycare groups is a common starting point, but it’s a ceiling, not a floor. Mixed-energy groups, where a high-drive border collie is playing alongside a senior beagle, require closer supervision than a well-matched group of medium-energy dogs. When group composition is mixed, target 1:8 or lower and assign one staff member specifically to monitor the highest-energy dogs.

Group play safety depends as much on how staff are positioned in the room as on the ratio itself. A staff member standing at the edge of a playroom sees less than one moving through the group.
Labor cost targets and scheduling
- Target labor at 35%–45% of revenue
- Schedule staff to match your actual dog count, not your maximum licensed capacity
- Use split shifts during shoulder hours (mid-morning, early afternoon) to reduce labor cost without reducing supervision quality during peak play times
- Cross-train every staff member across at least two service areas (daycare floor, boarding, reception) to cover gaps without overtime
Training minimums and certification
- New staff: minimum 8–16 hours of supervised on-floor training before solo supervision
- Core topics: off-leash group management, body language reading, bite prevention, first aid/CPR for dogs, escalation protocols, and emergency procedures
- Ongoing: at least quarterly refreshers on safety protocols; annual first aid recertification recommended
PSI’s Global Standards provide a public baseline for safety, contracts, and emergency preparedness that your training program should meet or exceed. The AVMA also publishes position statements on animal welfare that inform sound policy.
Turnover and retention
Pet care industry turnover is high. Operators who invest in clear onboarding, defined career paths, and a culture of safety tend to retain staff longer. Tracking 90-day and 12-month retention rates gives you an early signal when something in your culture or compensation is off.
Pro Tip: Cross-train your top two or three staff members to cover every role in the facility. During holiday peaks, this single investment prevents the scramble for last-minute coverage that drives overtime costs and supervision gaps.
How to collect, normalize, and act on your benchmarks
Knowing your target ranges is step one. Building a repeatable system to measure them is what actually moves the needle.
Step-by-step data collection plan
- At booking: capture service type (daycare/boarding/grooming), package vs. drop-in, duration, and price paid
- At check-in: record actual dog count by service type and assign to the correct playroom or kennel
- During the day: log any incidents, illness flags, or behavioral notes in a centralized system
- At check-out: confirm services rendered, capture any add-ons, and note no-shows or late cancellations
- At invoicing: reconcile revenue by service line so you can calculate ADR and RevPAS accurately
Software like Time To Pet can automate much of this data capture and reduce manual entry errors. The key is consistency: the same fields, captured the same way, every day.
Normalization for seasonality and pricing mix
Raw weekly revenue numbers are misleading without context. A slow January week looks alarming next to a December holiday week. Normalize by:
- Comparing the same week year-over-year, not just month-over-month
- Separating half-day and full-day pricing when calculating ADR (a half-day at $20 and a full day at $38 are not the same dog-day)
- Allocating grooming and add-on revenue to separate line items so daycare and boarding margins stay clean
Reporting cadence template
- Daily dashboard: dog count, utilization %, no-shows, any incidents
- Weekly KPI review: ADR, RevPAS, package penetration, cancellation rate, labor hours vs. dog count
- Monthly P&L with KPI overlay: gross and net margin, labor %, revenue by service line, client retention
For pre-peak planning, a seasonal budget review in September or October lets you set realistic capacity targets, adjust pricing, and hire or cross-train before demand spikes.
Break-even analysis
Formula: Fixed monthly costs ÷ (ADR minus variable cost per dog per day) = break-even dog-days per month.
If your fixed costs are $12,000/month, your ADR is $35, and your variable cost per dog is $5, you need 400 dog-days per month to break even. At 20 operating days, that’s 20 dogs per day. This matches the 12–20 dogs per weekday break-even range reported for typical U.S. single-location facilities. For deeper guidance on building your cost structure, the pet care budgeting resources at Thedoggurus walk through fixed vs. variable cost allocation in detail.
What the numbers don’t tell you: a perspective on benchmarks in practice
Most operators who struggle with their benchmarks don’t have a data problem. They have a prioritization problem.
The facilities we see plateau at $150,000–$180,000 in annual revenue almost always share the same pattern: they’re tracking occupancy but not package penetration, pricing by gut feel rather than by ADR targets, and scheduling staff based on maximum capacity rather than actual dog count. Each of those is a fixable problem, and none of them requires expensive software or a consultant.
The highest-leverage change we consistently see? It doesn’t just stabilize cash flow. It changes how you staff, how you forecast, and how you price. A drop-in-only facility can’t.
Valuation multiples are the other area where operators consistently underestimate the impact of operational discipline. A facility with documented systems, low owner-dependency, and clean financials commands a meaningfully higher multiple than one where the owner is the business. If you ever want to sell, the time to build those systems is now, not six months before you list.
Benchmarks are most useful when they’re honest. Don’t smooth your numbers to hit a target. The gap between where you are and where the benchmark says you should be is exactly where the growth opportunity lives.
Thedoggurus gives you the tools to close the gap between your numbers and your goals
You now have the benchmarks. The harder part is building the systems to measure them consistently, train your team to maintain them, and adjust when the numbers flag a problem.
Thedoggurus is the platform built specifically for dog daycare and boarding operators who want to move from guesswork to a clear, repeatable operating model. The platform includes staff training modules covering off-leash group management, safety protocols, and escalation procedures; financial tools and templates for tracking ADR, RevPAS, labor %, and margin; and coaching from operators who have built and run facilities themselves. Instead of piecing together spreadsheets and YouTube tutorials, you get a structured system that your whole team can use.
Ready to see where your facility stands? Explore the staff training and benchmarking tools at Thedoggurus and book a demo to get a personalized look at which metrics to prioritize first.
Sources
These are the primary sources behind the ranges in this guide. Each one serves a specific purpose for operators who want to dig deeper.
- AVMA companion animal care guidelines
- Dog Daycare & Boarding Business Valuation Benchmarks
- What are the most important KPIs every dog boarding… in 2027?
- Dog daycare: average revenue, profit and margins (2026) – BusinessDojo
A note on data caveats: All ranges in this guide reflect U.S. market conditions and should be interpreted with three adjustments in mind. First, geography matters: a $35 ADR is strong in a suburban Midwest market and below average in Manhattan. Second, seasonality distorts short-term readings; always compare the same period year-over-year. Third, most published benchmarks draw from self-reported operator data or small transaction samples, so treat ranges as directional guides rather than precise targets. Your own 12-month trend line is more useful than any single industry average.
This article is general information, not a substitute for advice from a qualified financial advisor. Consult a qualified financial professional about your own circumstances before acting on anything here.