

Track nine numbers and you can run a dog daycare and boarding business with real confidence: capacity utilization, average length of stay, daycare recurring-package penetration, revenue per pet (including ARPOKN for boarding), ancillary attach rate, repeat and retention rate, labor cost percentage, and no-show/cancellation rate. Review capacity and no-shows weekly, revenue and retention monthly, and labor and seasonality quarterly. If you only fix one thing this year, fix recurring-package penetration. It’s the KPI with the most leverage over every other number on this list.
TL;DR:
- Increasing recurring-package penetration by a few percentage points has the most leverage over overall revenue stability.
- Tracking peak versus off-peak utilization separately helps identify periods when capacity is underused and requires targeted marketing or pricing strategies.
- Maintaining ARPOKN within the mid-range of $55 to $85 ensures boarding pricing and add-ons align with your facility’s market tier.
- Monitoring no-shows and cancellations weekly enables timely adjustments to policies and reduces lost revenue from unfilled slots.
- Focusing on nine key KPIs, reviewed regularly, is more effective than tracking numerous metrics that do not directly influence profitability.
Table of Contents
- What Are the Most Important Dog Daycare KPIs to Track First?
- Operational KPIs: Capacity, Occupancy, and Length of Stay
- Financial KPIs: Revenue Per Pet, ARPOKN, and Labor Costs
- Why Recurring-Package Penetration Is the Top Lever
- Staffing and Service Quality Metrics That Protect Growth
- Building a Dashboard That Doesn’t Take Over Your Week
- Turning KPI Trends Into a Testing Playbook
- Where This Playbook Comes From
- Health and Safety Compliance Indicators Worth Tracking
- Marketing Metrics That Actually Predict Enrollment
- Managing the Seasonal Swings in Demand
- An Operator’s Take on Measuring What Matters
- Get Your Team Trained on These KPIs Faster
- Sources
What Are the Most Important Dog Daycare KPIs to Track First?
You don’t need forty metrics on a dashboard. You need the right nine, measured consistently, reviewed on a schedule you’ll actually keep. Here’s the starter list, with a plain-language reason each one earns its spot and the single action to take this week.
- Capacity utilization rate. Why it matters: every empty run or open kennel tonight is inventory you can never sell again. Definition: occupied slots divided by total available slots, by day part. This week: log daycare headcount and boarding kennel-nights at the same time daily, like 10:00 a.m., so you’re comparing apples to apples.
- Daycare recurring-package penetration. Why it matters: it’s the strongest predictor of stable cash flow you have. Definition: number of dogs on a package or membership divided by total active daycare dogs. This week: pull last month’s roster and calculate your current percentage.
- Revenue per pet / ARPOKN. Why it matters: shows whether you’re underpricing or leaving add-on revenue on the table. Definition: total revenue divided by unique pets served (daycare) or by occupied kennel nights (boarding). This week: run last month’s numbers by service line.
- Ancillary attach rate. Why it matters: small upsells compound fast without adding a single square foot of space. Definition: percentage of visits that include at least one add-on service. This week: audit your point-of-sale for how add-ons are logged.
- Repeat and retention rate. Why it matters: it’s cheaper to keep a client than to win a new one. Definition: percentage of clients who rebook within a defined window (commonly 90 days). This week: pull a client list from three months ago and check who hasn’t returned.
- Labor cost as a percent of revenue. Why it matters: staffing is usually your largest controllable cost. Definition: total labor cost divided by total revenue for the period. This week: pull last month’s payroll total against last month’s revenue.
- No-show and cancellation rate. Why it matters: unfilled peak-date slots are lost revenue you can’t recover. Definition: no-shows plus late cancellations divided by total bookings. This week: tag every no-show in your booking system for the past 30 days.
Operational KPIs: Capacity, Occupancy, and Length of Stay
A dog daycare and boarding facility sells perishable inventory. A daycare run or a boarding kennel that sits empty on Tuesday can’t be resold on Wednesday to make up the difference. That’s why capacity utilization sits at the top of every serious operator’s dashboard.
Daycare capacity utilization rate = dogs present ÷ total daycare capacity, measured at your peak hour each day. Boarding capacity utilization rate = occupied kennel nights ÷ available kennel nights over the period. Keep these separate. A facility running 90% daycare utilization at noon but only 55% boarding utilization on weeknights has two very different problems, and lumping them into one “occupancy” number hides both.
Average Length of Stay (ALOS) for boarding is total kennel nights sold divided by total unique reservations. A rising ALOS generally means more revenue per booking but slower kennel turnover, so you need to watch it alongside your cancellation calendar, not in isolation. A facility that jumps from a 3-night average to a 5-night average during summer might be filling up faster than the front desk realizes.
The biggest opportunity most operators miss is the gap between peak and off-peak utilization. Weekend boarding often runs near capacity while Tuesday and Wednesday nights sit half empty. Track peak and off-peak utilization as two separate lines on your dashboard, not a blended weekly average, or you’ll never see the problem clearly.
- Package Tuesday and Wednesday boarding at a discount tied to a minimum-night stay.
- Offer a limited-run “unlimited daycare” pass capped at a set number of visits per month to protect margin.
- Run a targeted promotion to past clients for off-peak dates two to three weeks out, not the week before.
- Test dynamic pricing on peak boarding nights (holidays, long weekends) where demand consistently outstrips supply.
Pro Tip: Set a recurring calendar reminder to compare peak versus off-peak utilization every Monday morning. The gap between the two tells you more about where to focus marketing dollars than either number alone.
Financial KPIs: Revenue Per Pet, ARPOKN, and Labor Costs
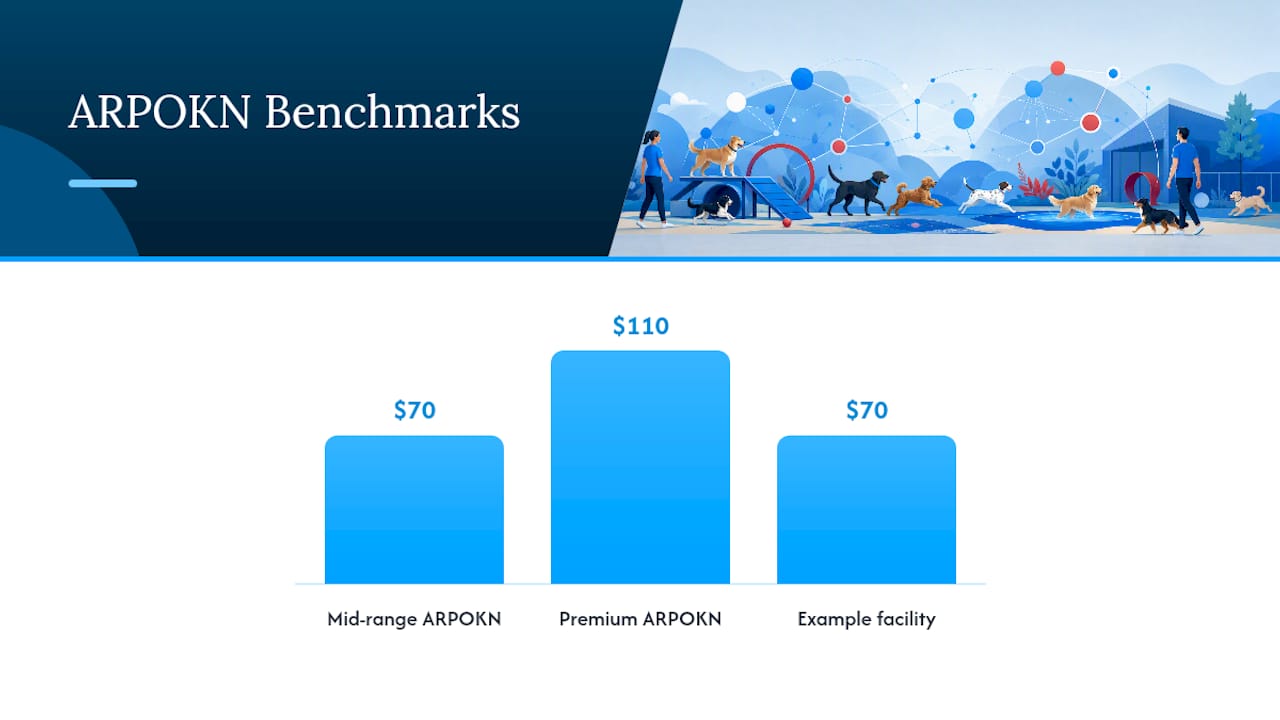
Revenue Per Pet = total daycare revenue ÷ unique pets served in the period. ARPOKN (Average Revenue Per Occupied Kennel Night) = total boarding revenue ÷ occupied kennel nights. If a facility books 400 occupied kennel nights in a month and generates $28,000 in boarding revenue, ARPOKN comes out to $70. That single number tells you more about pricing health than gross revenue ever will.
Benchmarks for ARPOKN typically run $55 to $85 for mid-range facilities and $90 to $130 for premium operations offering suites, webcams, and enhanced services. If your ARPOKN sits well below the mid-range band, you’re either underpriced, over-discounting, or under-selling add-ons at check-in. All three are fixable, and none require raising your base rate first.
Labor cost as a percent of revenue should generally land between 35% and 45%. Below 35% often signals you’re understaffed relative to demand, which shows up later as burned-out staff and rising incident rates. Above 45% usually means scheduling inefficiency rather than a wage problem, which is where Schedule Utilization Rate becomes essential: it measures whether the hours you’re paying for are actually productive, not just staffed.
Customer Acquisition Cost (CAC) = total marketing and sales spend ÷ new clients acquired in the period. Compare CAC against average first-visit revenue and projected lifetime value. If CAC is $45 and a new client’s average first booking only generates $30, you’re financing growth out of pocket until that client rebooks, which is exactly why retention and package penetration matter so much to the math.
- Revenue Per Pet reveals whether your average daycare visit is generating enough to cover labor and overhead.
- ARPOKN reveals whether boarding pricing and add-on attach are aligned with your facility tier.
- Labor % of revenue flags overstaffing or scheduling waste before it erodes margin.
- CAC against LTV tells you whether your marketing spend is actually profitable, not just active.
A deeper breakdown of margin drivers lives in our dog daycare profit margin analysis, and full target ranges for these numbers are laid out in our dog daycare benchmarks guide.
Why Recurring-Package Penetration Is the Top Lever
Daycare recurring-package penetration = number of dogs on a package, membership, or punch card ÷ total active daycare dogs. This single number does more to stabilize your monthly revenue than any marketing campaign, because clients on a package pre-commit to visits instead of deciding day by day whether to book.
Retention and churn should be tracked in cohorts, not as one blended annual number. Group clients by the month they started (a 30-day cohort, a 90-day cohort, a 180-day cohort) and watch how each group’s rebooking rate holds up over time. A steep drop-off between the 30-day and 90-day mark usually points to an onboarding problem, not a service problem.
ARPU by cohort (average revenue per user, split between members and drop-in clients) tells you whether your package pricing is actually capturing the value members receive. If drop-in clients are spending nearly as much per visit as members are spending per package, your package price is probably too low relative to the discount it offers.
- Build an assessment-day funnel that converts first-time visitors into a package offer before they leave the building.
- Strengthen onboarding communication in the first two weeks, when most cancellations actually originate.
- Offer a capped unlimited pass (say, 12 visits per month) to protect margin while still giving clients the psychological comfort of “unlimited.”
- Revisit lapsed members at the 60-day mark with a targeted win-back offer rather than a generic newsletter.
Our recurring revenue guide walks through package pricing structures in more detail, and our retention programs resource covers the tactics that actually move churn.
Pro Tip: Don’t just track overall retention. Track it separately for members versus drop-in clients. Members almost always retain better, and the gap tells you exactly how much a package is worth in real dollars, not theory.
Staffing and Service Quality Metrics That Protect Growth
- Trainer-to-dog ratio. A typical peak-hour ratio runs around 1:6, though it should flex with breed mix, group size, and your physical layout. This ratio directly affects both your liability exposure and your pricing power. A tighter ratio justifies a premium rate; a loose one invites incidents.
- Schedule Utilization Rate (SUR). Calculated as productive staff hours ÷ total paid staff hours, SUR should generally land between 65% and 75%. A SUR below that range means you’re paying for downtime, even if your labor percentage looks fine on paper.
- Incident and injury rate. Track incidents per 1,000 dog-days to normalize for volume. Rising incident rates almost always precede a drop in your retention numbers a few months later, so treat this as an early warning system, not just a compliance log.
- No-show and cancellation rate. Industry ranges typically run 5% to 15%, and a target under 10% is realistic for most facilities with a clear deposit policy. Requiring a deposit or a card on file, paired with an automated reminder 24 hours out, can cut no-shows roughly in half.
For more on tying staff productivity to accountability systems, see our operations manual resource.
Building a Dashboard That Doesn’t Take Over Your Week
Every KPI above has a formula. Here’s the shortlist, ready to drop into a spreadsheet or dashboard tool:
| KPI | Formula |
|---|---|
| Capacity utilization | Occupied slots ÷ total available slots |
| Average length of stay | Total kennel nights ÷ unique reservations |
| Recurring-package penetration | Dogs on package ÷ total active daycare dogs |
| Revenue per pet | Daycare revenue ÷ unique pets served |
| ARPOKN | Boarding revenue ÷ occupied kennel nights |
| Ancillary attach rate | Visits with add-on ÷ total visits |
| Repeat and retention rate | Rebooked clients ÷ total clients (per window) |
| Labor cost % | Total labor cost ÷ total revenue |
| SUR | Productive staff hours ÷ total paid staff hours |
| No-show/cancellation rate | No-shows + late cancels ÷ total bookings |
Pull your raw numbers from four places: your booking or scheduling system, your point-of-sale, your payroll platform, and your CRM for client history. Set one logging rule that applies to everyone on staff: every add-on, every no-show, and every cancellation gets tagged at the moment it happens, not reconstructed later from memory.
A workable dashboard layout groups metrics by how often they need your attention:
- Weekly: occupancy, capacity utilization, no-show rate.
- Monthly: revenue per pet, ARPOKN, attach rate, retention by cohort.
- Quarterly: labor cost percent, SUR, seasonal concentration risk.
This structure matches what a focused 5 to 9 KPI scorecard recommends before expanding further. Weekly capacity checks paired with a monthly revenue and attach-rate review, as industry KPI guidance suggests, catches most problems while they’re still cheap to fix.
Turning KPI Trends Into a Testing Playbook
Measuring is only half the job. The other half is running small, deliberate experiments against the numbers that move the needle most.
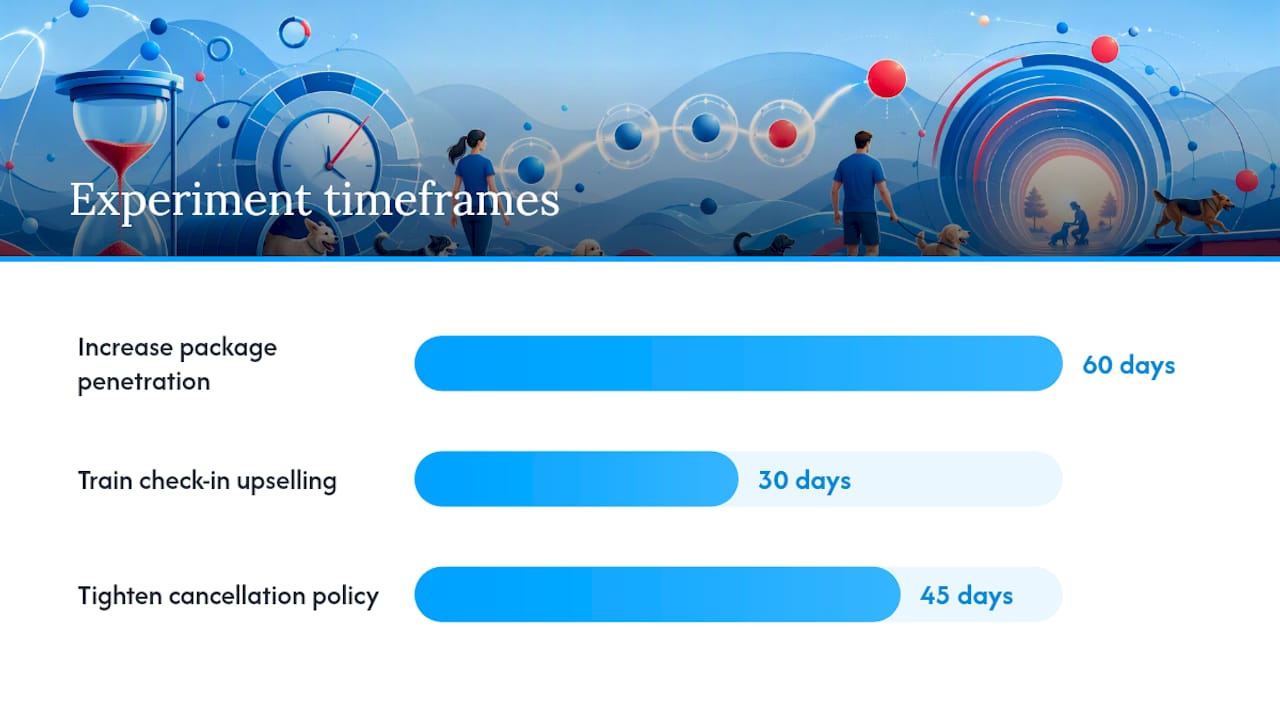
- Increase package penetration. Timeframe: 60 days. Owner: front desk lead. Watch: recurring-package penetration. Hypothesis: a structured assessment-day offer can lift penetration by several percentage points without discounting existing packages.
- Train check-in upselling. Timeframe: 30 days. Owner: shift supervisor. Watch: ancillary attach rate. Hypothesis: a simple upsell script at check-in, offering a $3 to $10 add-on, compounds into meaningful annual revenue gains without adding staff or space.
- Tighten cancellation policy. Timeframe: 45 days. Owner: operations manager. Watch: no-show/cancellation rate. Hypothesis: requiring a deposit on peak-date bookings cuts no-shows meaningfully within one billing cycle.
- Test dynamic pricing on peak boarding nights. Timeframe: one holiday season. Owner: owner or GM. Watch: ARPOKN. Hypothesis: a modest surcharge on high-demand nights raises ARPOKN without softening demand.
Run each pilot against a comparable prior period, not a gut feeling, and give it enough time to clear a normal week-to-week swing before judging it. If a test clears its hypothesis for two consecutive review cycles, make it permanent policy rather than re-testing it a third time.
Pro Tip: Assign exactly one owner per experiment. A test with two owners rarely gets the follow-through it needs, and you’ll lose the ability to tell which KPI moved because of which change.
Where This Playbook Comes From
This framework reflects what The Dog Gurus has built through years of hands-on coaching and training work with dog daycare, boarding, and pet care operators. The platform combines expert-led courses, published benchmarking data, and templated playbooks so owners aren’t building KPI systems from scratch.
If you want to go deeper on the numbers covered here, our profit margin benchmarks and recurring revenue resources both expand on the formulas above. At a high level, the platform’s tools support dashboard-building and staff training around exactly the metrics covered in this guide, without requiring you to hire a data analyst first.
Health and Safety Compliance Indicators Worth Tracking
Health and safety compliance isn’t a separate concern from your financial KPIs. It’s an input to them. A rising incident rate quietly erodes retention months before it shows up as a revenue problem.
Track a handful of compliance indicators alongside your operational metrics. Vaccination compliance rate measures the percentage of active clients with current, on-file vaccination records, and it should sit close to 100% given the liability exposure of gaps. Incident rate per 1,000 dog-days normalizes bite, scratch, and injury reports for volume so you can compare month to month fairly. Cleaning and sanitation log completion rate tracks whether your team is actually completing required cleaning checkpoints, not just whether a policy exists on paper.
Staff certification currency (pet first aid, CPR, dog behavior training) should be tracked as a percentage of staff current on required certifications, reviewed quarterly alongside your labor metrics.
Complaint tracking deserves its own line separate from general customer feedback. Log complaints specifically related to safety or cleanliness, and review them monthly. A spike here, even a small one, tends to precede a retention drop by roughly one to two billing cycles, giving you a real early-warning window if you’re watching for it.
Marketing Metrics That Actually Predict Enrollment
Not every marketing metric deserves a place on your dashboard. Impressions and social engagement rarely translate into booked kennels. The metrics that predict enrollment growth are the ones tied directly to conversion and cost.
Lead-to-tour conversion rate measures the percentage of inquiries that convert into a scheduled assessment day or tour. Tour-to-enrollment rate measures how many of those tours actually convert into a paying client. If your lead volume is healthy but enrollment is flat, the problem usually sits in one of these two conversion steps, not in your ad spend.
Customer Acquisition Cost by channel breaks your CAC calculation down by source (referral, paid social, local search, walk-in) so you can see which channel actually produces profitable clients rather than just cheap leads. A referral program often produces the lowest CAC and the highest first-90-day retention, since referred clients arrive with a built-in trust signal a cold lead doesn’t have.
Referral rate = number of new clients from referrals ÷ total new clients in the period. This number tends to correlate closely with your retention rate, since happy long-term clients are the ones who refer. Track it monthly alongside package penetration, since the two metrics tend to move together for a reason: both reflect genuine satisfaction rather than a discount-driven signup.
Managing the Seasonal Swings in Demand
Boarding demand for most facilities spikes hard around major holidays and summer travel weeks, then drops sharply in the weeks that follow. Tracking seasonal boarding concentration (the percentage of annual boarding revenue generated during your top four to six peak weeks) shows you exactly how exposed your cash flow is to those windows.
Track this ratio quarterly and compare it year over year, not just against your own prior quarter, since a single unusually strong holiday season can mask a longer-term dependency problem.
The practical fix is a pre-peak checklist run at least two weeks before each major holiday window: confirm staffing levels, finalize peak-date pricing, and tighten deposit requirements on high-demand bookings before the calendar fills. Waiting until the week of a holiday to adjust pricing or staffing is almost always too late.
Off-peak periods deserve their own strategy, not just a discount. Bundling a mid-week boarding rate with a daycare package, or running a targeted email to lapsed clients two to three weeks before a historically slow stretch, tends to outperform a blanket discount because it targets demand you can actually predict rather than hoping for walk-ins.
An Operator’s Take on Measuring What Matters
Keep it simple. The facilities that win aren’t the ones tracking forty metrics. They’re the ones checking nine numbers on a consistent schedule and actually acting on what they see. Watch out for vanity metrics like social follower counts. They feel good and mean almost nothing for cash flow. Common mistakes: blending peak and off-peak occupancy into one number, tracking retention annually instead of by cohort, and letting labor percentage substitute for a real look at scheduling waste.
— Oliver
Get Your Team Trained on These KPIs Faster
Building the dashboard is only step one. Getting your team to actually log the data consistently, execute the upsell scripts, and follow the cancellation policy is where most operators lose momentum. Thedoggurus built Staff Products specifically to close that gap, combining role-specific training modules, ready-to-use templates, and hands-on coaching so your front desk and play-area staff aren’t guessing at what “track attach rate” actually means day to day.
A subscription gives your whole team access to the same playbooks, not just you, which is usually where KPI rollouts stall in smaller facilities. Instead of writing your own training materials from scratch, you get a system already built around the metrics covered in this guide. Visit the Staff Products page to see current plans and get your team started this month.