

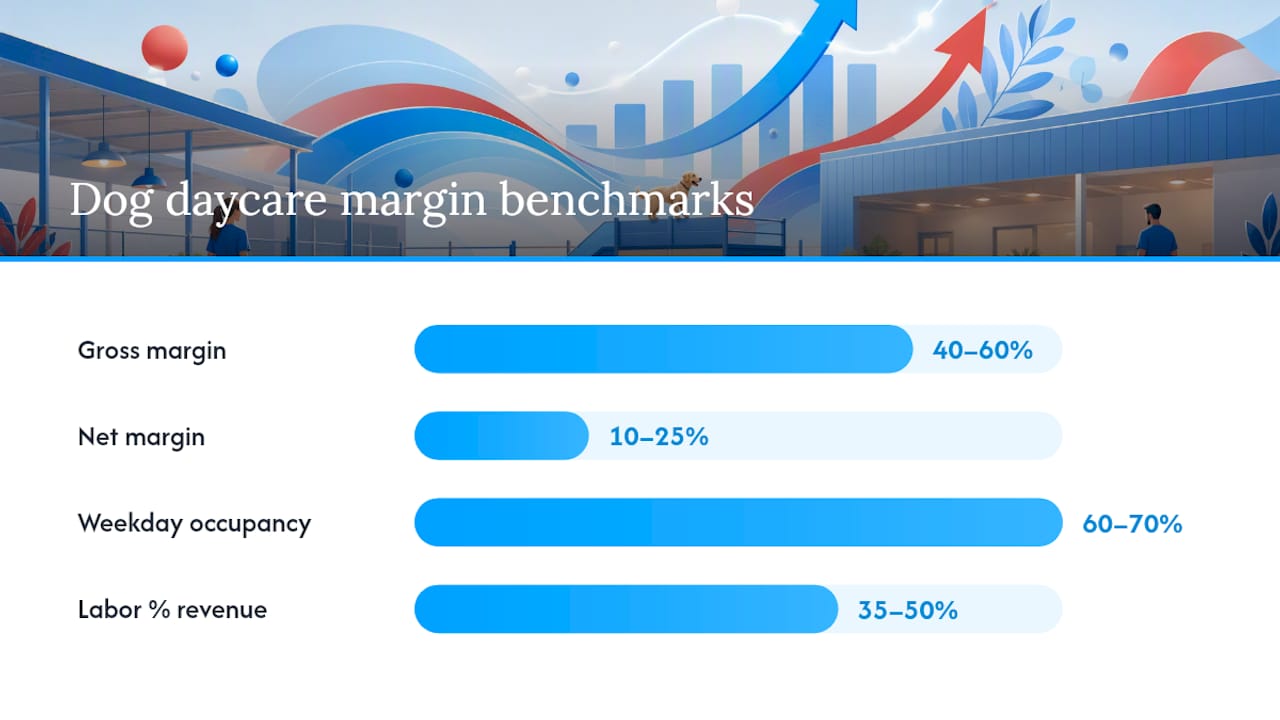
A well-run dog daycare typically lands a net margin of 10–25% and a gross margin of 40–60%. If your numbers sit below that band, three levers move the needle most: labor as a percentage of revenue, daily utilization, and add-on service revenue.
Here’s what that looks like in practice. A facility charging $35 per dog-day with 30 dogs attending daily generates $1,050 in daily revenue. That single shift can add $6,300 per month in revenue against nearly zero incremental cost, which is why utilization is the fastest margin lever you have.
The three primary drivers, in priority order:
- Labor %: Payroll typically consumes about one-third to half of revenue. Dropping it by 5 points adds roughly 5 points of net margin.
- Utilization: Filling 60–70% of safe capacity is the common break-even threshold. Every dog above that threshold is high-margin revenue.
- Add-ons: Grooming, boarding, and training can account for 20–40%+ of total revenue and carry better contribution margins than base daycare.
Key Takeaways
A dog daycare’s net margin lives or dies on three variables: labor percentage, daily utilization, and add-on revenue mix.
| Point | Details |
|---|---|
| Net margin benchmark | Well-run facilities target 10–25% net and 40–60% gross margin. |
| Break-even occupancy | Most facilities need 60–70% weekday utilization to cover fixed costs. |
| Labor is the primary lever | Payroll at 35–50% of revenue is healthy; above 55% requires immediate staffing review. |
| Add-ons lift blended margin | Boarding, grooming, and training can contribute 20–40%+ of revenue at higher margins than base daycare. |
| Thedoggurus | The platform provides financial tools, pricing playbooks, and coaching to help owners hit their margin targets. |
Table of Contents
- What do healthy dog daycare profit margins actually look like?
- Where your revenue actually comes from
- What eats your margin: the major cost categories
- Break-even math: worked examples for three facility sizes
- How to increase daycare profits: the 5 highest-impact levers
- The monthly KPIs every owner should track
- Startup costs and the realistic timeline to profitability
- How to run your own break-even calculation
- Where these numbers come from and what to validate for your market
- What the numbers don’t tell you about building a profitable daycare
- Thedoggurus gives you the financial tools and coaching to hit your margin targets
- Sources
What do healthy dog daycare profit margins actually look like?
Before you can improve your numbers, you need a clear benchmark set to measure against. The table below gives you the key metrics, their typical ranges, and what each one means for your operation.
| Metric | Healthy Range | Action Threshold |
|---|---|---|
| Gross margin | 40–60% | Below 35%: review pricing and variable costs |
| Net margin | 10–25% | Below 10%: audit labor % and occupancy |
| Day rate (full-day) | $25–$40 per dog | Below market: reprice or repackage |
| Weekday occupancy | 60–70% (break-even) | Below 55%: marketing and retention priority |
| Labor % of revenue | 35–50% | Above 55%: staffing model needs review |
| Revenue per sq ft (annual) | $50–$100 | Below $40: underutilized space |
| Customer LTV | $1,500–$3,500 | Below $1,000: churn is too high |
| CPA (cost per acquisition) | $50–$150 | Above $200: marketing ROI is negative |
Day rates vary significantly by market. Urban facilities in high-cost metros often charge $45–$65 per dog-day, while suburban and rural markets sit closer to $25–$35. Tracking cost per dog-day and reviewing pricing regularly is how you protect margin as input costs rise.
A few additional benchmarks worth knowing:
- LTV to CPA ratio: Aim for at least 10:1. If LTV is $2,000 and CPA is $100, you’re in a healthy acquisition position.
- Revenue per sq ft: Facilities that plan space carefully around safe billable capacity consistently outperform those that don’t. Every square foot that isn’t generating revenue is a cost center.
- Churn rate: Monthly churn above 5% erodes LTV fast. Retention programs pay for themselves quickly.
Where your revenue actually comes from
Daycare day rates are the volume engine, but they’re not your best margin source. Understanding each stream’s contribution margin helps you decide where to invest time and marketing dollars.
Core daycare (day rates, $25–$40/dog-day): This is your highest-volume stream and your primary utilization driver. It fills your facility and creates the daily client relationship. The contribution margin per dog-day is real but thin once you account for variable labor, supplies, and wear-and-tear. Think of it as the foundation, not the profit center.
Overnight boarding ($45–$85/night): Boarding carries a stronger contribution margin than daycare because the overnight rate is higher, the incremental labor cost is modest (one overnight staff member covers many dogs), and you’re monetizing space that would otherwise sit empty. Boarding and grooming are the high-margin multipliers that improve your blended profitability.

Grooming ($40–$120 per session): Grooming revenue is almost pure contribution margin once a groomer is on staff. A groomer handling 5–6 dogs per day at $70 average generates $350–$420 daily from a single employee. Adding grooming to your pet care business revenue mix is one of the clearest paths to a higher blended margin.
Training ($75–$200 per session or $300–$600 per package): Training has the highest per-hour revenue of any pet care service. It also builds deep client loyalty. Adding dog training revenue to your existing daycare client base requires minimal marketing spend because you’re selling to people who already trust you.
Leashes, treats, supplements, and branded merchandise convert naturally at checkout. Keep SKU count tight and focus on consumables clients repurchase.
Memberships and unlimited passes: Packages and unlimited monthly passes change your unit economics in two ways. They increase ARPU (average revenue per user) and improve attendance predictability. The risk: a heavily discounted unlimited pass filled by a client who attends every single day can actually reduce per-visit revenue below your variable cost. Discounted packages only work when they fill low-utilization days; price them accordingly.
Pro Tip: *Build your package pricing by calculating your variable cost per dog-day first. If your variable cost is $8 and your day rate is $35, your contribution margin is $27. An unlimited monthly pass priced at $450 for 20 days of attendance ($22.50/day) still covers variable costs but compresses margin.
What eats your margin: the major cost categories
Knowing where money leaks is the first step to stopping it. Here’s how a typical dog daycare P&L breaks down by cost category.
Payroll is a large portion of revenue, often consuming roughly one-third to half. This is your largest cost and your primary margin lever. The math is driven by handler ratios. Most operators plan around 10–15 dogs per handler, with tighter ratios for puppies or high-energy groups. A facility running 12 dogs per handler at a $35 day rate generates $420 in revenue per handler-shift. Add management, admin, and overnight staff and total payroll climbs quickly.
A facility paying several thousand dollars per month in rent that runs around 40 dogs daily at $35 generates revenue on the order of about thirty thousand dollars monthly, with rent representing a notable portion of revenue. Same lease, very different margin.
Budget $3,000–$8,000 annually for a small-to-medium facility. Skimping here is a false economy.
Proper ventilation is a safety requirement, not a luxury, and it runs continuously. Budget accordingly.
These scale with dog count, making them a true variable cost.
Track CPA carefully; spending $200 to acquire a client with $1,200 LTV is a losing trade.
Minor but meaningful leak points:
- Discounting without tracking the margin impact
- No-show clients who hold a spot but don’t pay (implement a cancellation policy)
- Overstaffing on slow Mondays and Fridays when attendance predictably drops
- Untracked retail shrinkage
Break-even math: worked examples for three facility sizes
The break-even formula is straightforward: break-even units = fixed costs / (selling price – variable cost per unit). The contribution-margin formula is the engine behind every scenario below.
Small facility (10–20 dogs/day capacity)
- Safe capacity: 20 dogs/day
- Average day rate: $32
- Variable cost per dog-day: $9 (supplies, variable labor portion)
- Contribution margin per dog-day: $23
- Monthly fixed costs: $14,000 (rent $3,500, base payroll $8,000, insurance $500, utilities $1,200, marketing $800)
- Break-even dog-days/month: $14,000 / $23 = 609 dog-days/month
- Break-even daily attendance (22 operating days): 609 / 22 = 28 dogs/day — which exceeds safe capacity
This scenario shows why a 20-dog facility with $14,000 in fixed costs is structurally difficult. You need to either raise the day rate, cut fixed costs, or add a boarding/grooming revenue stream to reach break-even within safe capacity.
Medium facility (20–50 dogs/day capacity)
- Safe capacity: 50 dogs/day
- Average day rate: $35
- Variable cost per dog-day: $10
- Contribution margin per dog-day: $25
- Monthly fixed costs: $22,000
- Break-even dog-days/month: $22,000 / $25 = 880 dog-days/month
- Break-even daily attendance: 880 / 22 = 40 dogs/day (80% of capacity)
Add grooming revenue of $5,000/month and net margin improves meaningfully.
Large facility (50+ dogs/day capacity)
- Safe capacity: 80 dogs/day
- Average blended day rate (daycare + add-ons): $42
- Variable cost per dog-day: $12
- Contribution margin per dog-day: $30
- Monthly fixed costs: $30,000
- Break-even dog-days/month: $30,000 / $30 = 1,000 dog-days/month
- Break-even daily attendance: 1,000 / 22 = 46 dogs/day (57% of capacity)
This is the power of scale.
Sensitivity: how utilization and labor % shift net margin
Pro Tip: Run this sensitivity table with your own numbers every quarter. A 10-point swing in utilization can move net margin by 6–8 points. That’s the difference between a business that’s surviving and one that’s building real wealth.
How to increase daycare profits: the 5 highest-impact levers
These are ranked by ROI and implementation speed. Start at the top.
1. Optimize your handler ratios and scheduling
Labor is your biggest cost and your most controllable one. Review your daily attendance patterns for the past 90 days and identify your three lowest-attendance days per week. Those are your overstaffing days. Shift one handler to part-time on those days or cross-train them to cover grooming or retail. A 3-point reduction in labor % on 12 days per month adds meaningful net margin without touching revenue.
Safe compression matters here. Never drop below the handler ratios your state or local regulations require, and never below what your facility’s layout and dog population demand. Staff training and enrichment scheduling help you maintain safety at tighter ratios.
2. Raise your day rate to market
Most daycare owners underprice. If you haven’t raised rates in 18 months, you’ve absorbed inflation without compensation. A $3 increase on 40 dogs/day is $120/day or $2,640/month in pure contribution margin. Survey your local market, check what competitors charge for comparable services, and price to the 60th–70th percentile. Setting profitable pricing requires knowing your cost floor first, then pricing above it with confidence.
3. Add or grow a high-margin service line
Boarding and grooming are the two fastest paths to a higher blended margin. If you have overnight capacity, boarding should be your first add. If you have a grooming bay or can add one, grooming is your second. Both services use existing infrastructure and existing client relationships.
4. Build a retention program that reduces churn
Acquiring a new client costs $50–$150. Keeping an existing one costs almost nothing. A pet retention program that includes loyalty rewards, birthday perks, and proactive communication can cut monthly churn by 2–3 points. On a 200-client base, that’s 4–6 fewer clients you need to replace each month.
5. Automate admin and reduce no-shows
Every no-show that holds a spot costs you the contribution margin of a dog you could have booked. Implement a 24-hour cancellation policy with a fee, use automated reminders, and track no-show rates by client. Software that handles scheduling, billing, and reminders pays for itself quickly in recovered revenue.
The monthly KPIs every owner should track
You can’t fix what you don’t measure. These 9 KPIs give you a complete picture of your margin health in under 30 minutes per month.
- Labor % of revenue: Total payroll / total revenue. Target: 35–50%. Above 55% requires immediate action.
- Revenue per dog-day: Total monthly revenue / total dog-days attended. Tracks blended pricing and add-on uptake.
- Revenue per sq ft (annual): Annual revenue / total sq ft. Target: $50–$100. Below $40 means underutilized space.
- Occupancy rate: Actual dog-days / (safe capacity × operating days). Target: 70%+ for healthy margin.
- Customer LTV: Average monthly spend × average months retained. Target: $1,500–$3,500.
- CPA: Total marketing spend / new clients acquired. Target: below $150.
- Monthly churn rate: Clients lost / total clients at start of month. Target: below 5%.
- ARPU (average revenue per user): Total monthly revenue / active clients. Tracks upsell effectiveness.
- Net margin %: Net profit / total revenue. Your headline number. Target: 10–25%.
Weekly checks (takes 10 minutes): Occupancy for the current week vs. prior week, labor hours scheduled vs. actual, and any no-shows or cancellations above your baseline.
Monthly checks (takes 20 minutes): All 9 KPIs above, plus a review of your top 10 clients by revenue and any clients who reduced attendance frequency.
Startup costs and the realistic timeline to profitability
New owners consistently underestimate both startup costs and the time it takes to reach break-even. Here’s what the data shows.
Break-even timelines typically range from 8–20 months depending on facility size, staffing model, and ramp speed. Marketing investment and add-on services can shorten that window.
The ramp-up phase is the riskiest period. Many owners underestimate the working capital needed to sustain operations while building a client base, with 12–24 months commonly cited as the full ramp period for a commercial facility. Plan for at least 6 months of operating expenses in reserve before you open.
Factors that shorten break-even:
- Pre-opening waitlist of 20+ committed clients
- Strong referral network or existing pet community presence
- Adding boarding from day one (higher revenue per client)
- Lean staffing model with cross-trained team members
Factors that lengthen it:
- High lease cost relative to market day rates
- Slow marketing ramp with no pre-opening client base
- Regulatory delays or licensing complications
- Undercapitalization that forces premature discounting
For context on owner income expectations: home-based owners typically earn $25,000–$60,000, single commercial locations $60,000–$150,000, and high-performing or multi-location operators can exceed $150,000 depending on utilization and revenue mix. For guidance on the full startup process, the starting a dog daycare and boarding resource covers licensing, common pitfalls, and upfront investment planning.
How to run your own break-even calculation
You don’t need a complex spreadsheet to get a reliable break-even estimate. Here’s the step-by-step process using the contribution-margin formula.
List your monthly fixed costs. Include rent, base payroll (minimum staffing regardless of attendance), insurance, utilities, software subscriptions, and any fixed marketing spend. Add them up. This is your fixed cost total.
Set your average day rate. Use your actual blended rate if you offer multiple services, or your standard daycare day rate if you’re modeling daycare only.
Calculate your variable cost per dog-day. Include supplies, waste disposal, food (if provided), and the variable portion of labor (hours added per additional dog). A typical range is $7–$12 per dog-day.
Compute contribution margin per dog-day. Subtract variable cost from day rate. Example: $35 day rate – $9 variable cost = $26 contribution margin.
Divide fixed costs by contribution margin. $20,000 fixed costs / $26 contribution margin = 769 dog-days per month to break even.
Convert to daily attendance. Divide by your operating days (typically 22). 769 / 22 = 35 dogs/day to break even.
Check against safe capacity. If break-even daily attendance exceeds your safe capacity, your model has a structural problem. You need to raise rates, cut fixed costs, or add a higher-margin revenue stream.
Quick sanity checks:
- If contribution margin is zero or negative (variable cost equals or exceeds day rate), stop. No volume of attendance fixes a negative contribution margin. Reprice immediately.
- If break-even attendance is above 85% of safe capacity, your margin of safety is too thin. A slow week will put you in the red.
- If break-even is below 60% of safe capacity, you have a healthy model with room to grow.
Where these numbers come from and what to validate for your market
The benchmarks in this article draw from U.S.-market data published by industry-focused financial modeling sources, pet care software providers, and operator communities. The core sources are cited throughout with links. Key modeling assumptions you should validate for your own situation:
- Operating days: These scenarios use 22 operating days per month. If you operate 7 days a week, recalculate using 30 days.
- Payroll treatment: Base payroll is modeled as a fixed cost; incremental handler hours are modeled as variable. Your actual payroll structure may differ.
- Handler ratios: The 10–15 dogs per handler benchmark reflects common U.S. practice. Your state or local jurisdiction may have specific licensing requirements that set a lower maximum. Always check with your state’s Department of Agriculture or equivalent licensing body.
- Tax and regulatory costs: Business license fees, state-specific employment taxes, and local zoning compliance costs vary significantly. These are not included in the margin benchmarks above and will reduce your actual net margin.
- Insurance: Rates vary by location, facility size, and claims history. Get quotes from insurers who specialize in pet care businesses rather than using generic commercial rates.
- Day-rate ranges: The $25–$40 benchmark reflects national averages. Urban markets in New York, San Francisco, or Chicago regularly see rates of $50–$70. Rural markets may sit at $20–$28. Use your local competitive set, not the national average, for your own model.
What the numbers don’t tell you about building a profitable daycare
The biggest early mistake most owners make isn’t a pricing error or a staffing miscalculation. It’s opening without a clear picture of their break-even dog count and then discounting to fill the building.
Discounting feels like a growth strategy. It isn’t. When you drop your day rate from $35 to $28 to attract clients during the ramp phase, you’re not just reducing revenue per dog. And the clients you attract at the discounted rate are the hardest to reprice later.
The behavior that most reliably predicts later profitability is tracking cost per dog-day from week one and making pricing decisions based on that number, not on what feels competitive. Owners who know their numbers make better decisions under pressure. They don’t panic-discount during slow weeks. They identify the real problem (low utilization, high churn, wrong client mix) and fix it at the root.
A practical first-90-days checklist for new owners:
- Days 1–30: Set up your KPI tracking spreadsheet or software. Record every dog-day, every expense, and every new client acquisition source.
- Days 31–60: Calculate your actual cost per dog-day and compare it to your day rate. Identify your top three expense lines and whether they’re tracking to benchmark.
- Days 61–90: Review occupancy trend. If you’re not at 50% of break-even attendance by day 90, your marketing or retention needs immediate attention, not your pricing.
The Doggy Daycare Training guide covers staff development practices that help you maintain safety at efficient handler ratios, which directly supports the labor % target.
Thedoggurus gives you the financial tools and coaching to hit your margin targets
Running a profitable dog daycare means knowing your numbers, building the right team, and making smart operational decisions every month. That’s exactly what Thedoggurus is built to help you do.
The platform combines financial tools, pricing playbooks, and expert-led coaching in one place, so you’re not piecing together advice from a dozen different sources. Whether you need help modeling your break-even, building a retention program that cuts churn, or training your team to run at safe and efficient handler ratios, the tools and guidance are ready when you are. Owners who use the platform get access to benchmarking analytics that show how their KPIs compare to similar facilities, plus role-specific staff training that reduces incident risk without inflating labor cost.
The result: less time putting out fires, more time growing a business that actually pays you well. Visit Thedoggurus to see the platform, or go directly to the owner products page to find the plan that fits your facility size and goals.
Sources
The benchmarks, formulas, and scenarios in this article draw from the following U.S.-market sources. All cover dog daycare economics in the U.S. context; data periods are noted where available.
- Dog Daycare Center: Profitability Guide (2026) – BusinessDojo
- Dog Daycare break-even calculator — Calculop
- Dog Daycare Business Idea Overview — StartupFinancialProjection